Conducting Multivariate Analysis in R for PhD Dissertations

Doctoral research frequently involves analyzing complex datasets containing multiple variables that interact in meaningful ways. Traditional statistical techniques that examine one variable at a time often fail to capture these complex relationships. As a result, many scholars rely on multivariate analysis in R to explore patterns, relationships, and structures within their research data.
R is a widely used statistical tool in academia due to its flexibility, extensive libraries, and ability to perform advanced statistics for dissertations. For PhD scholars working with survey, experimental, or observational datasets, R offers powerful tools for exploring multivariate relationships and generating robust research findings.
In this article, we have developed a comprehensive guide to conducting multivariate analysis using R for doctoral dissertations. In addition, the article contains the commonly used methods and challenges faced when conducting multivariate analysis in R.
Understanding Multivariate Analysis in R
Multivariate analysis refers to statistical techniques used to analyze datasets containing multiple variables simultaneously. Instead of examining variables individually, multivariate methods investigate how variables interact and influence one another. Using multivariate analysis in R enables researchers to evaluate complex relationships more effectively than with simple statistical methods.
Common multivariate techniques include:
- Principal component analysis (PCA)
- Factor analysis
- Cluster analysis
- Discriminant analysis
- Multivariate analysis of variance (MANOVA)
- Structural equation modeling (SEM)
These methods allow researchers to reduce data complexity, identify hidden structures, and test relationships among variables.
Why Use Multivariate Analysis in R for Dissertation Data Analysis
PhD students often choose R because of its versatility and strong statistical capabilities. Compared with many traditional statistical software packages, R provides greater flexibility and transparency in research.
- Open-source and cost-effective: One of the biggest advantages of R for doctoral research is that it is completely free. Doctoral students, data analysts and researchers can access powerful statistical tools without expensive licensing fees.
- Extensive statistical libraries: R contains thousands of packages designed for specialized statistical analysis. These packages allow researchers to perform advanced statistics R techniques without needing to write complex algorithms from scratch.
- Reproducible research: Reproducibility is essential in academic research. With R, researchers can document every step of their analysis through scripts. This makes it easier to reproduce results and maintain transparency in analyzing dissertation data.
- Powerful visualization tools: R provides excellent data visualization tools, such as ggplot2, which allow researchers to present complex dissertation results clearly and effectively.
Key Methods of Multivariate Analysis in R
Understanding the most commonly used multivariate techniques is essential for doctoral researchers. Each method serves a different purpose depending on the research question and dataset. Key methods of multivariate analysis in R include:
1. Principal Component Analysis (PCA)
Principal component analysis is widely used to reduce large datasets into smaller sets of variables while preserving most of the information in the data. PCA transforms correlated variables into uncorrelated principal components, which can then be used to identify patterns and correlations in the data. For example, a researcher studying student engagement may collect dozens of survey variables. PCA can reduce these variables into a smaller number of components that represent broader dimensions such as motivation, participation, and satisfaction.
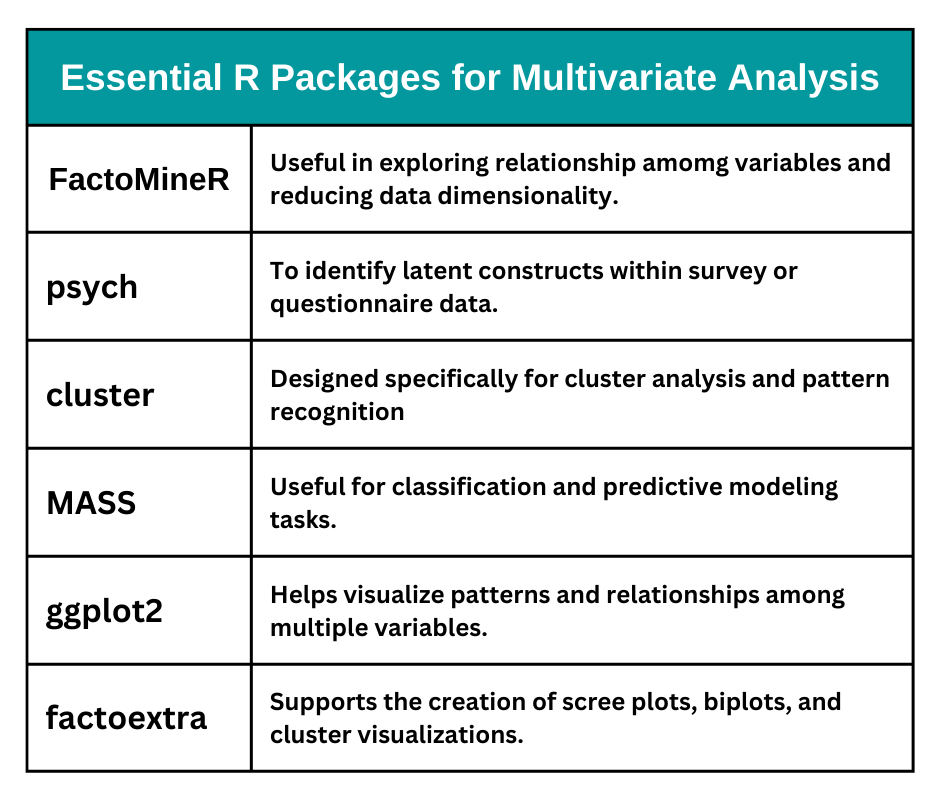
PCA is useful for visualizing high-dimensional data in two or three dimensions. In R, PCA can be performed using functions such as prcomp(), princomp(), or packages like FactoMineR::PCA() and psych::principal()
2. Factor Analysis
Factor analysis is commonly used in social sciences to identify latent variables that explain correlations among observed variables. Factor analysis is frequently used in dissertation data analysis when developing or validating measurement scales. By specifying the number of factors and a rotation method, researchers can better interpret the patterns of interrelationships among variables and reduce the complexity of their data.
Several R packages that support factor analysis include:
- psych
- factoextra
- stats
3. Cluster Analysis
Cluster analysis is a widely used method of multivariate analysis in R that enables researchers to group observations into clusters based on similarities across multiple variables. In multivariate datasets, cluster analysis helps identify natural groupings within the data without predefined categories, making it particularly useful for exploratory research and pattern detection.
In R, cluster analysis can be implemented using several functions and packages that support both hierarchical and non-hierarchical clustering techniques. Researchers can use R packages such as stats, cluster, and factoextra to perform clustering, visualize cluster structures, and evaluate clustering results.
4. Multivariate Analysis of Variance (MANOVA)
MANOVA is an extension of ANOVA that allows researchers to analyze multiple dependent variables simultaneously. This technique is useful when researchers want to compare groups across several outcomes. For example, an education researcher might compare different teaching methods based on multiple learning outcomes such as test scores, engagement levels, and retention rates.
In R, MANOVA can be performed using functions such as manova(, which allows researchers to test the effect of one or more independent variables on multiple dependent variables. MANOVA is an important technique in advanced statistics R because it allows for comprehensive comparisons across multiple variables.
A Step-by-Step Guide to Performing Multivariate Analysis in R
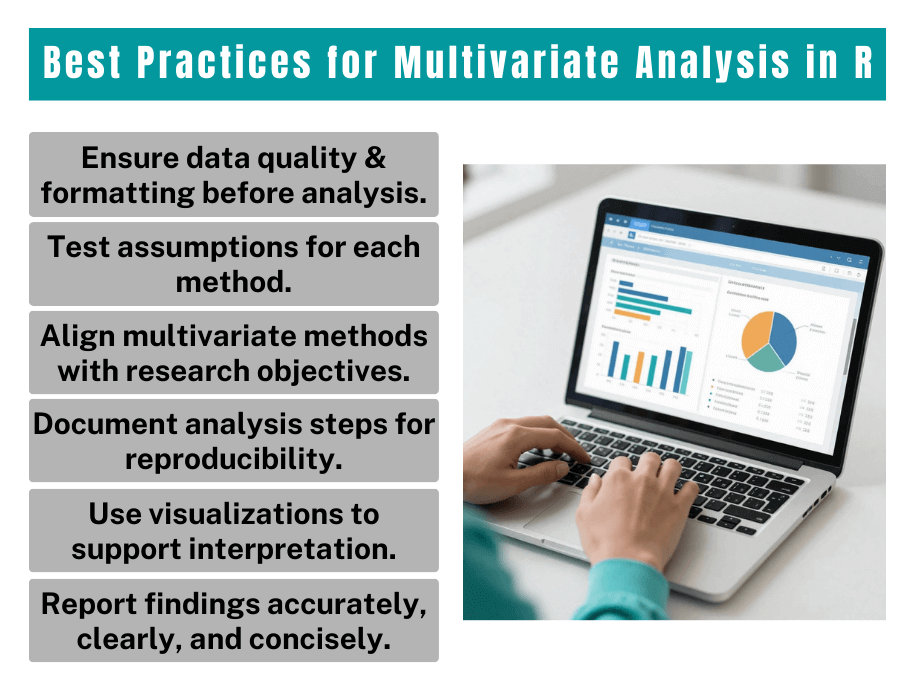
Doctoral researchers should follow a systematic approach when performing multivariate analysis for PhD dissertation. A structured workflow helps ensure accurate and reliable results. Below is the step-by-step process of conducting multivariate analysis in R.
Step 1: Prepare and Clean the Data
Data preparation is one of the most critical stages of multivariate analysis because inaccurate or poorly organized data can lead to misleading results. Researchers should begin by examining the dataset for missing values and deciding whether to remove, replace, or impute them depending on their frequency and pattern. It is also important to detect and manage outliers that may distort statistical results.
Variables should be checked to ensure they are correctly coded and formatted, especially when dealing with categorical variables or numerical scales. In R, functions such as na.omit(), summary(), and scale() are commonly used during the data cleaning stage.
Step 2: Conduct Exploratory Data Analysis
Before applying multivariate techniques, researchers should conduct exploratory data analysis to gain a general understanding of the dataset. This process may include examining summary statistics, generating correlation matrices, and creating simple data visualizations to identify patterns or relationships among variables.
Exploratory analysis helps researchers detect potential issues in the data and determine which multivariate methods are most appropriate for addressing the research objectives. Visualizations such as histograms, scatterplots, boxplots, and correlation matrices can also help identify patterns, relationships, and potential problems in the dataset. In R, packages like ggplot2 and functions such as pairs() and cor() are often used to perform exploratory analysis.
Step 3: Apply Multivariate Techniques
After exploring and preparing the dataset, researchers can proceed with applying suitable multivariate statistical analysis methods. The choice of technique depends on the research question, the type of variables involved, and the structure of the dataset. Common approaches include principal component analysis, factor analysis, and cluster analysis, each of which serves different analytical purposes.
Selecting the correct technique allows researchers to effectively analyze complex relationships among multiple variables. Once the appropriate method has been identified, researchers can apply it using the relevant R functions and packages. For instance, PCA can be conducted using prcomp() and cluster analysis using kmeans() or hclust().
Step 4: Interpret the Results
Interpreting statistical results is a critical component of doctoral research. Rather than simply reporting numerical outputs, researchers should clearly explain the meaning and implications of the findings. Key elements that often require interpretation include factor loadings, eigenvalues, cluster membership, and overall model significance. Thoughtful interpretation helps connect statistical results to the research objectives and strengthens the academic quality of the study.
Step 5: Visualize and Report Findings
Visualization plays an important role in communicating complex multivariate results in a clear and understandable manner. Graphical representations allow researchers to present patterns and relationships that may not be easily understood from tables alone. In R, visualization packages such as ggplot2 and factoextra are commonly used to present results effectively. Incorporating such visualizations can enhance the clarity, impact, and overall presentation of research findings in a dissertation or academic report.
Major Challenges in Multivariate Analysis in R for Doctoral Research
While multivariate analysis is powerful, doctoral researchers may encounter several challenges during the analysis process.
- Data complexity: Multivariate datasets can contain many variables, making interpretation difficult. Dimensionality reduction techniques such as PCA help address this issue.
- Statistical assumptions: Many multivariate methods require assumptions such as normality, independence, and linearity. Researchers must test these assumptions before conducting the analysis.
- Programming skills: Some doctoral students may have limited programming experience. However, with practice and the availability of online resources, learning R for doctoral research becomes manageable.
Summary
Conducting multivariate analysis in R is an essential skill for many PhD scholars conducting complex quantitative data analysis. Multivariate techniques allow researchers to examine relationships among multiple variables simultaneously, uncover hidden structures in data, and produce more comprehensive research findings. R provides an ideal platform for data analysis because it offers powerful tools for advanced statistics.
By learning how to prepare data, apply appropriate multivariate methods, and interpret statistical results effectively, doctoral students can significantly enhance the quality and rigor of their dissertations. With careful application and thoughtful interpretation, R becomes a powerful resource for conducting high-quality academic research. Click here to place an order or talk to our live customer service agents for help with conducting multivariate analysis for PhD dissertations.