Performing Factor Analysis in SPSS for a Dissertation

Factor analysis is a multivariate statistical technique that is used to extract underlying explanatory constructs that substantially account for multiple observed variables. With factor analysis, a few latent factors are extracted from several interrelated manifest variables and are used to explain the total variance in the observed variables. By employing factor analysis in PhD dissertations, scholars are able to simplify complex data and set a strong foundation for a deeper and more focused analysis.
Multiple software packages, such as the Statistical Package for Social Sciences (SPSS), R, SAS, STATA, and Python, can be utilized to conduct factor analysis. SPSS is frequently licensed by colleges and universities, so it is widely available for scholars conducting doctoral research. In this article, we have discussed a detailed step-by-step procedure that PhD students can follow to conduct factor analysis in SPSS. We have also outlined useful recommendations scholars can apply to get the best results from their factor analysis.
Understanding Factor Analysis in SPSS
SPSS is a statistical analysis platform, developed by IBM Corporation, that is designed to help individuals and organizations with managing, analyzing, and presenting data to derive useful insights. SPSS is used to conduct factor analysis in doctoral research because the software provides a user-friendly interface that allows scholars to describe variability among a set of observed, correlated variables. Instead of manually computing output, including correlation matrices and eigenvalues, PhD students can use SPSS to automatically conduct factor analysis and acquire clear visual representations, such as scree plots that are easy to interpret. Key reasons why SPSS is suitable for factor analysis in PhD dissertation include:
- Highly intuitive graphical user interface. SPSS has an easy-to-use interface that allows scholars to prepare data and conduct factor analysis without writing code. Its intuitive design makes it particularly suitable for PhD students with minimal programming experience.
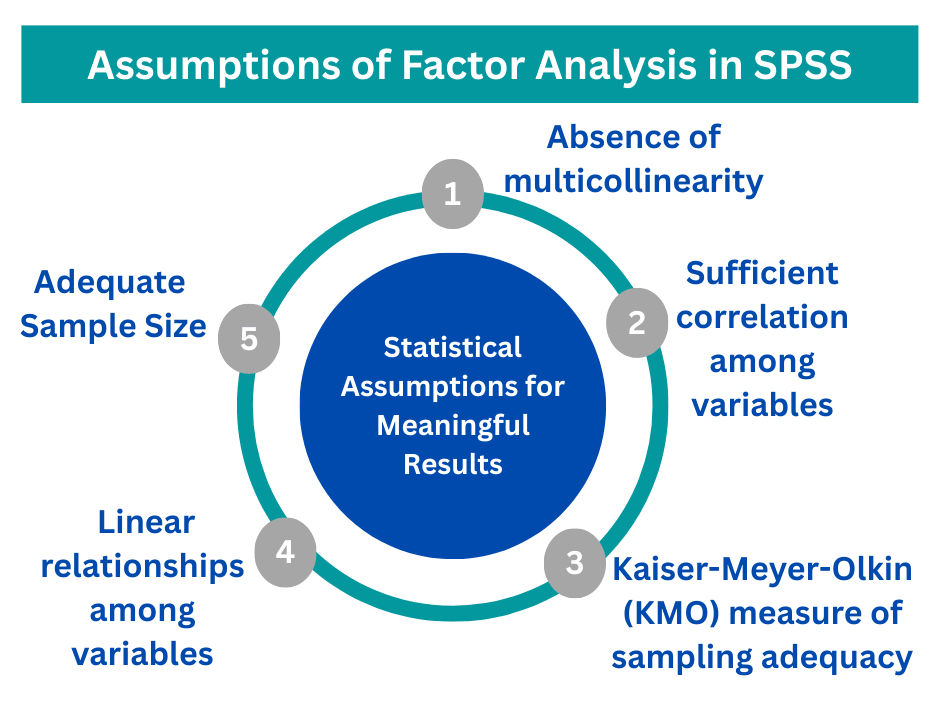
- Allows scholars to check for assumptions of factor analysis. In the Descriptives dialog in SPSS, scholars can add a few statistics to verify the assumptions of factor analysis. To verify assumptions, scholars can utilize the Kaiser-Meyer-Olkin (KMO) test of sphericity and the Anti-Image Correlation matrix in SPSS.
- Enables factor analysis rotation to help in the interpretation of results. SPSS allows PhD students to conduct orthogonal and oblique rotation, thereby simplifying the interpretation of the observed variables.
- Built-in factor analysis techniques. With SPSS, scholars can perform various techniques for factor analysis, such as (i). principal component analysis, (ii). principal axis factoring, (iii). maximum likelihood, (iv). alpha factoring, and (v). image factoring.
Types of Factor Analysis Used in SPSS
Scholars conducting PhD research can perform two main types of factor analysis in SPSS, which include exploratory and confirmatory. Exploratory factor analysis for a dissertation aims to uncover the latent structure within a large set of variables. Confirmatory analysis for a dissertation is used to determine the relationship between factors or variables in a dataset.
Step-by-Step Process of Factor Analysis in SPSS
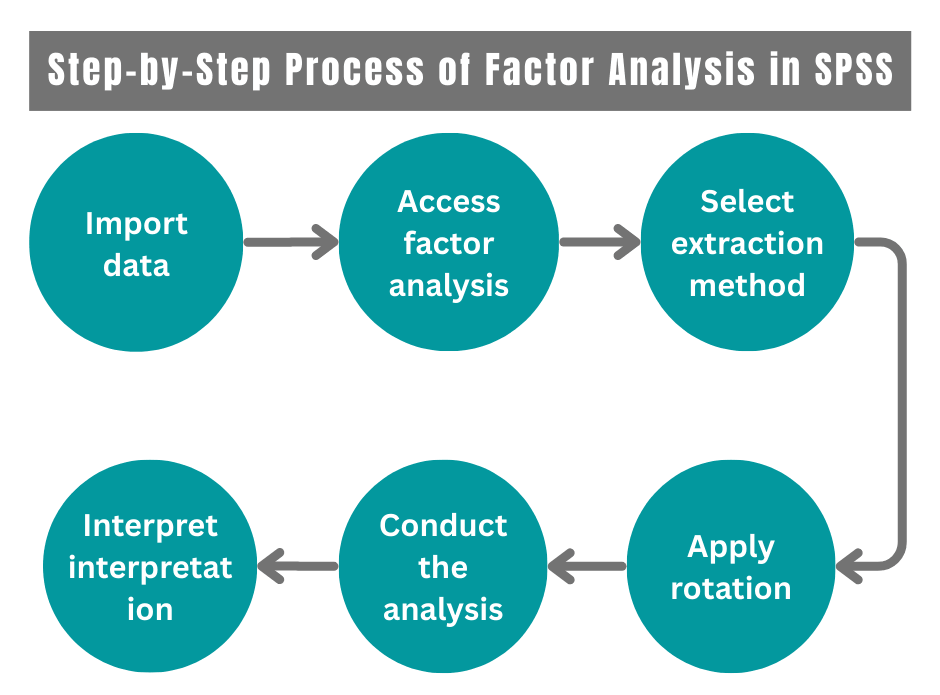
The procedure of conducting factor analysis in SPSS involves:
Step 1: Import Data
Scholars can use SPSS to import data from a CSV, Excel, or any other text-based file using the File>Import data option. This opens up a pop-up dialogue that allows PhD students to select the file and upload it. Once the file has been selected, scholars can either have SPSS read the file or select advanced options to manually input the data from a file.
Step 2: Access Factor Analysis
Scholars should access the main dialog box by using the Analyze > Data reduction > Factor menu path. PhD students then select the variables to be included in the factor analysis and transfer them to the box labelled Variables. Scholars should only include variables related to each other and exclude any that were identified as problematic during the data screening.
Step 3: Select Extraction Method
From the dialogue box, scholars should click on the extraction method to load another dialogue box. Factor extraction methods that scholars conducting dissertation research can employ in SPSS include (i). Principal Component Analysis (PCA), (ii). Principal Axis Factoring (PAF), (iii) Maximum Likelihood, (iv) Alpha Factoring, (v) Image Factoring. Scholars should select the number of factors to extract or utilize the default criteria.
Step 4: Apply Rotation
The interpretability of factors can be improved through rotation. By applying rotation, PhD students can maximize the loading of each variable on one of the extracted factors while minimizing the loading on all other factors. First, scholars should click on the Rotation to access the dialog box. Varimax, quartimax, and equamax are orthogonal rotations, whereas direct oblimin and promax are oblique rotations. The rotation method selected depends on whether the scholar thinks the underlying factors should be related.
Step 5: Conduct the Analysis
Doctoral students should click on “OK” on the main dialog box to run the factor analysis. The results should appear in the output SPSS file. SPSS generates output tables that contain the factor loadings, eigenvalues, and explained variance.
Step 6: Output Interpretation
SPSS output for factor analysis typically comprises (i). correlation matrix, (ii). KMO and Bartlett’s test, (iii). correlation matrix, (iv). communalities, (v). total variance explained, (vi). scree plot, (vii). component matrix, and (viii) rotated component matrix. The correlation matrix demonstrates Pearson correlation coefficients between pairs of items. High correlation suggests that the items may share underlying factors. For the KMO and Bartlett’s test, the KMO value demonstrates the suitability of the data for factor analysis. Digits that are closer to 1 suggest that the scholar’s data is highly factorable.
Best Practices for Conducting Factor Analysis in SPSS
This section highlights useful recommendations scholars can employ when conducting factor analysis in SPSS to achieve the best results for their research.
- Use an adequate sample size. Factor analysis is a large-sample procedure, and generalizable results are unlikely if the sample is too small. In factor analysis, adequate sample size is determined by the nature of the data. Generally, the higher the quality of the data, the smaller the sample size needed to obtain reliable factor analysis results. High-quality data for factor analysis are characterized by uniformly high communalities, minimal cross-loadings, and several variables loading strongly on each factor.
- Utilize appropriate rotation methods. SPSS offers two main types of factor rotations, which include orthogonal and oblique rotations. If scholars expect the factors to be independent, they should employ one of the orthogonal rotations. A commonly used orthogonal rotation is varimax, as it simplifies the factor interpretation by minimizing the number of variables with high loadings for each factor. However, if there are theoretical grounds for supposing that factors might correlate, then the direct oblimin should be selected.
Summary
Factor analysis is an essential quantitative analysis technique used to describe variability among observed, interrelated variables. Factor analysis allows scholars to simplify multiple complex variables to explore the underlying constructs that explain the relationships between the variables. SPSS is used by scholars conducting graduate research to perform factor analysis.
SPSS has various features that make it suitable for factor analysis in PhD research, including its highly intuitive interface, built-in factor analysis techniques, and rotation options that help with the interpretation of results. For PhD scholars struggling with conducting factor analysis in SPSS, they can consider buying advanced services from experts to understand their complex data. Contact our data analysts today for help with factor analysis in SPSS.