Structural Equation Modeling (SEM) in SPSS and R: A Comparative Guide

Structural Equation Modeling (SEM) is an advanced quantitative research method that outperforms standard multivariate techniques by modeling multiple dependent and independent variables simultaneously, providing a complex understanding of relationships within data. SEM integrates techniques such as multiple regression and factor analysis, enabling statisticians to test complex theoretical models.
Various software programs can handle SEM models, including the Statistical Package of Social Sciences (SPSS), R, STATA, SAS, and jamovi. This article focuses on structural equation modeling in SPSS and R, highlighting the key differences between the two software programs, such as the user interface, cost, customization, learning curve, reproducibility, and output.
What is Structural Equation Modeling in SPSS?
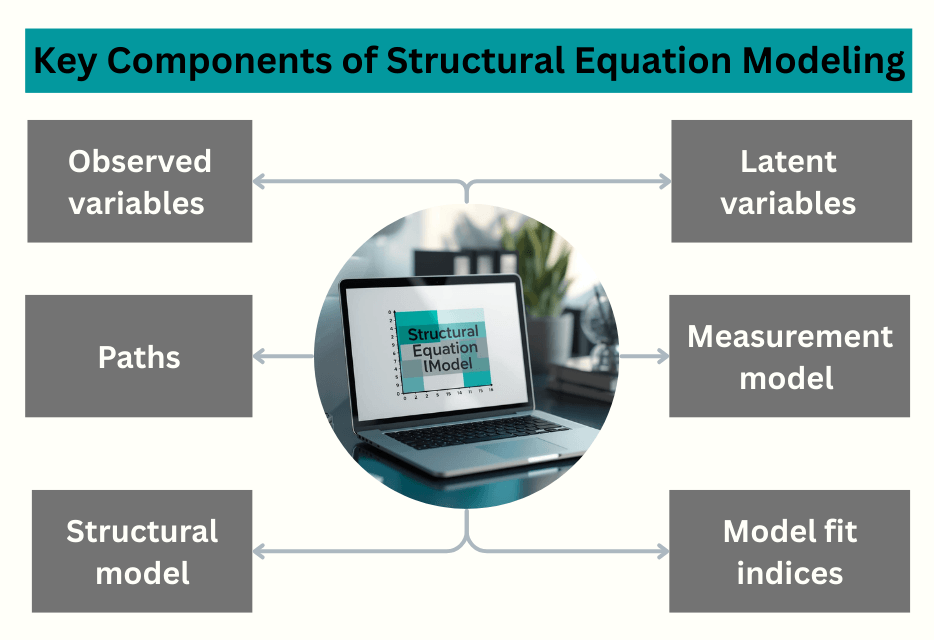
Structural Equation Modeling (SEM) is a generalized framework that includes multiple regression, path and factor analysis, simultaneous econometric equations, and latent growth curve models, and is used to analyze relationships among multiple variables.
SEM has numerous benefits, some of which include:
i). Estimating the effects of hypothetical constructs.
ii). Accounting for potential errors of measurement.
iii). Enabling researchers to model the direct, indirect, and total effects of a system of variables.
IBM SPSS Analysis of Moment Structures (Amos) is a SEM software that helps investigators support their research by extending standard multivariate analysis methods, including regression, factor analysis, correlation, and ANOVA. SPSS Amos qualities that make it suitable for SEM include an intuitive interface, easy data entry, and access to a range of features for modeling.
The step-by-step process of performing SPSS Amos analysis involves:
Step 1: Specifying the model.
Step 2: Loading the data set.
Step 3: Estimating the model.
Step 4: Assessing the model fit.
Step 5: Estimating parameters.
What is SEM in R?
SEM in R is the use of the programming language to test complex relationships involving observed and latent variables. To effectively identify these relationships, SEM is categorized into two main components, including the measurement and structural models. The measurement model is used to specify the relationship between the observed and corresponding latent variables. The structural model is utilized to specify the relationship between latent variables.
The R programming language has multiple packages and extensions that researchers can use to conduct SEM, including lavaan, sem, and OpenMx. R also has various features that make it suitable for conducting SEM, including versatile model specification syntax, advanced estimation techniques, and integrated tools for model visualization and reporting. The step-by-step process of conducting SEM in R involves:
Step 1: Creating a path diagram that shows the measurement and structural model of interest.
Step 2: Identify the level of measurement for each item and identify distributional assumptions.
Step 3: Ensuring the fitting function is based on measurement types.
Step 4: Assessing model fit.
Key Differences Between Structural Equation Modeling in SPSS and R
SEM in SPSS, using the Amos add-on, and in R software, utilizing the lavaan, sem, and OpenMx packages, differ significantly in factors such as user interface and learning curve. In this section, we have highlighted the key differences between conducting structural equation modeling in SPSS and R.
1. User Interface
SPSS contains an easy-to-use graphical interface with an advanced computing engine for SEM. The SPSS Amos add-in has publication-quality path diagrams that provide a clear representation of models for scholars and researchers. The SPSS graphical user interface is therefore highly intuitive, especially for beginner statisticians and scholars.
R is a syntax-driven, interpreted programming language that is designed for statistical computing and graphics. R relies on specific, case-sensitive code commands executed line-by-line in a console, using functions and packages to analyze complex relationships between directly observed and latent variables. R analysis, therefore, has a steeper learning curve but delivers comprehensive results.
2. Cost
SPSS is a commercially distributed software suite that is utilized for data management and statistical analysis. To conduct SEM, researchers can only access the SPSS Amos add-in with the traditional on-premises licensing option. Amos is included in the premium edition of SPSS Statistics, which is priced at $105 per authorized user, except in the Campus edition, where it is sold separately. Alternatively, researchers can buy Amos as part of the base, standard, and professional editions of SPSS Statistics, or separately as a standalone application.
R is an open-source programming language used by statisticians and researchers who need to perform SEM and analyze multivariate data using various quantitative techniques such as multiple regression, factor analysis, and path analysis. With R, researchers can avoid high licensing costs and gain access to advanced packages such as lavaan, sem, and OpenMx that enable users to conduct efficient SEM. The benefit of utilizing SEM in R is that it is open source, freely available, and relatively easy to use.
3. Output
SEM in SPSS, via the Amos add-on, produces output that comprises text and graphics, illustrating the model fit, path coefficients, and measurement model validity. The SPSS Amos output focuses on several key components, including (i) the goodness of fit indices, (ii) Maximum Likelihood Estimates, and (iii) squared multiple correlations. Additionally, SPSS produces standardized residuals that can be used to identify discrepancies between observed and predicted values and modification indices that suggest adjustments to enhance model fit.
The output of SEM in R, which is usually produced by the summary() function of the lavaan package, contains (i) the model fit, (ii) parameter estimates, and (iii) standard errors. The parameter estimates include regression paths, loadings, and variances. Additionally, the output contains both a measurement and a structural model.
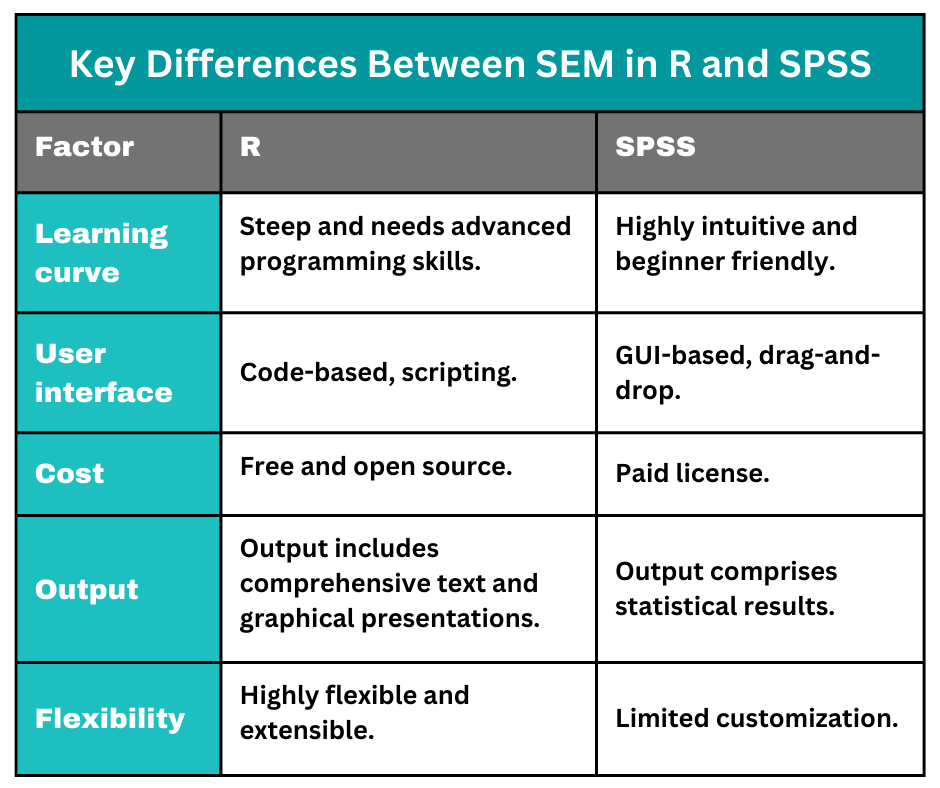
Comparison Table Demonstrating the Differences Between SEM in R and SPSS
This table demonstrates the main differences between structural equation modeling in SPSS and R:
Summary
SEM is a broad framework that involves various techniques, including multiple regression, path analysis, and factor analysis, among others. Statisticians can utilize various software programs to conduct SEM, including SPSS, R, STATA, SAS, and jamovi, depending on their research objectives. Each software suite has its distinct benefits, which influence how statisticians model the complex relationships between observed and latent variables. In case you are struggling with structural equation modeling in SPSS or R, you can consider buying professional services from expert statisticians for specialized assistance. Click here to join our live chat and talk to our customer service agents for help with structural equation modelling in SPSS and R.